Fractality of street networks (working progress)
Lasse P. S. H. / May 2024
Fractals in street networks
Fractals are prevalent in nature, and human structures are no exception. Street networks, for instance, exhibit fractal properties and follow a power-law distribution. The Power law distribution is a continuous positive-only, univariate distribution that describes a quantity whose probability decreases as a power of its magnitude, i.e.,
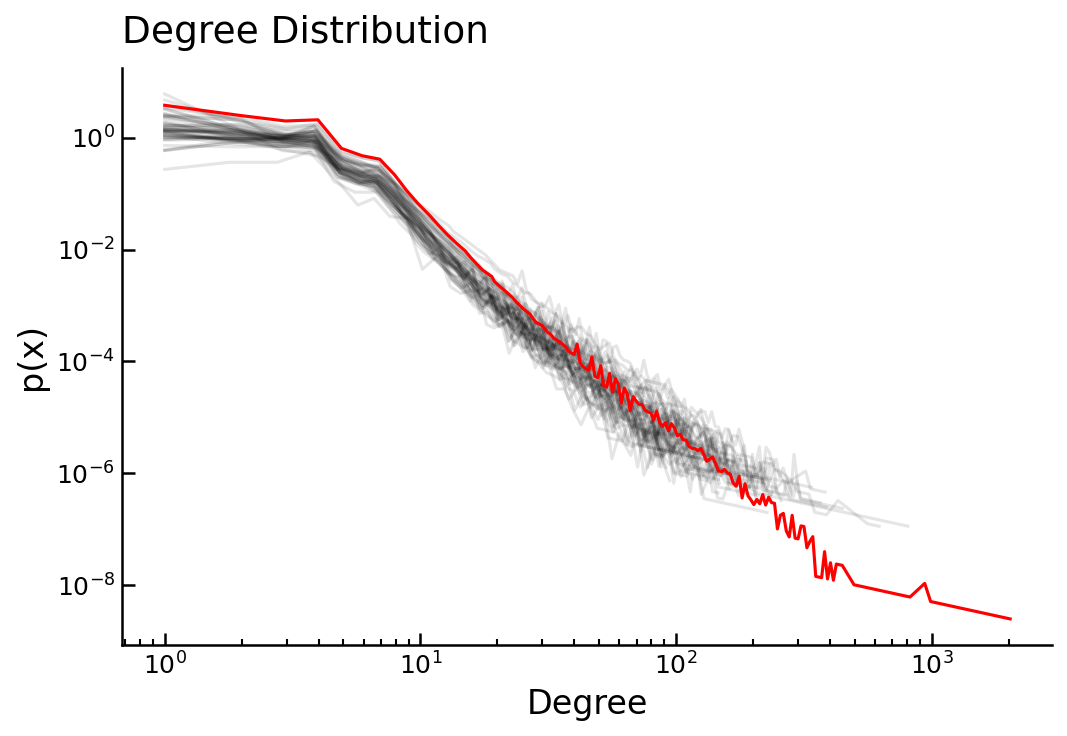
\[f(x) = ax^{-k}\]The figure below shows the degree distribution of 52 different cities using a dual graph representation with a direction continuity approach 1.
 Figure 1: Degree Distribition
It can be observed that there are two phase shifts in the distribution. The second phase follows a power law, indicating a self-similarity mechanism where the distribution appears consistent across different magnitudes. The fundamental building blocks of the fractal structure are evident in the first phase of the distribution. This concept is also applicable in urban planning, often referred to as the “15-minute city.” In this model, most daily necessities and services—such as work, shopping, education, healthcare, and leisure—are easily accessible within a 15-minute journey. Each “15-minute city” unit can be seen as a basic building block of the urban fractal, where these self-sufficient neighborhoods combine to form the larger urban structure, maintaining the self-similarity at different scales.
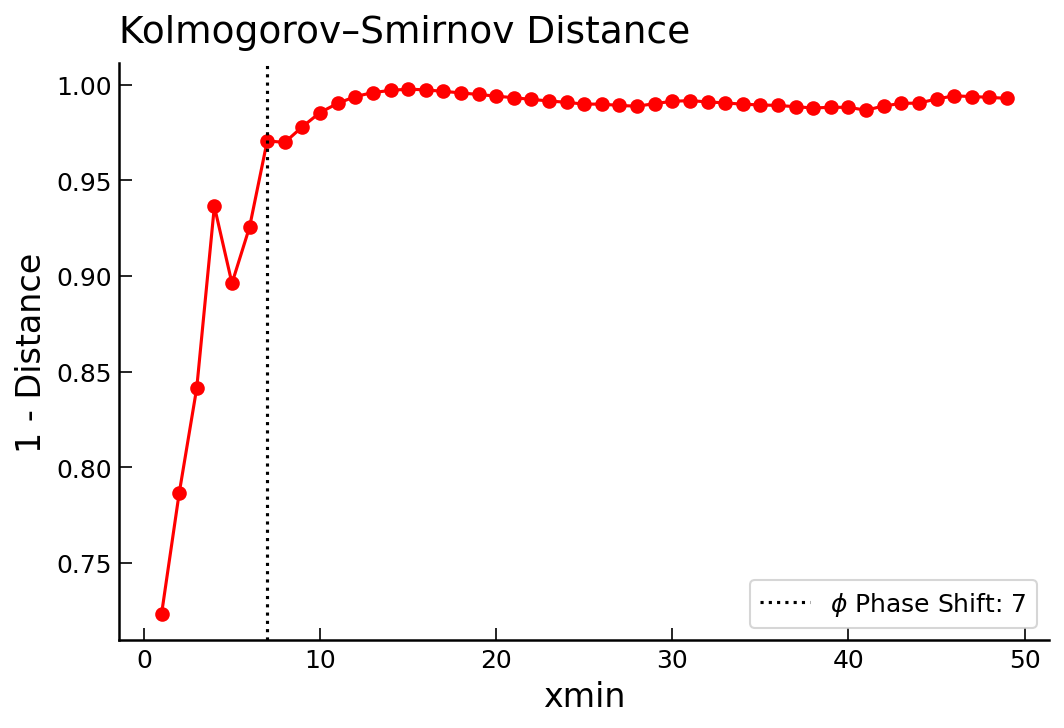
To further evaluate the onset of the second phase and the initiation of fractality, a Kolmogorov-Smirnov (KS) test is employed with varying lower bounds of \(x\). The figure illustrates the KS distance minus 1, where higher values indicate a better fit to the model. The phase shift is “eyeballed” around 7 at the elbow of the point of the curve.

Geometrical Fractals
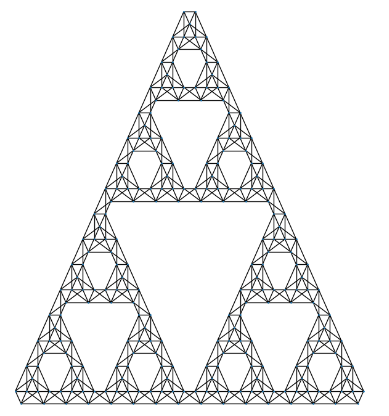
To further understand this, we can compare the network distribution to known geometrical fractals, such as the Sierpinski triangle. The figure below shows the dual graph representation of the Sierpinski triangle.
 Figure 2: Dual graph representation of Sierpinske triangle
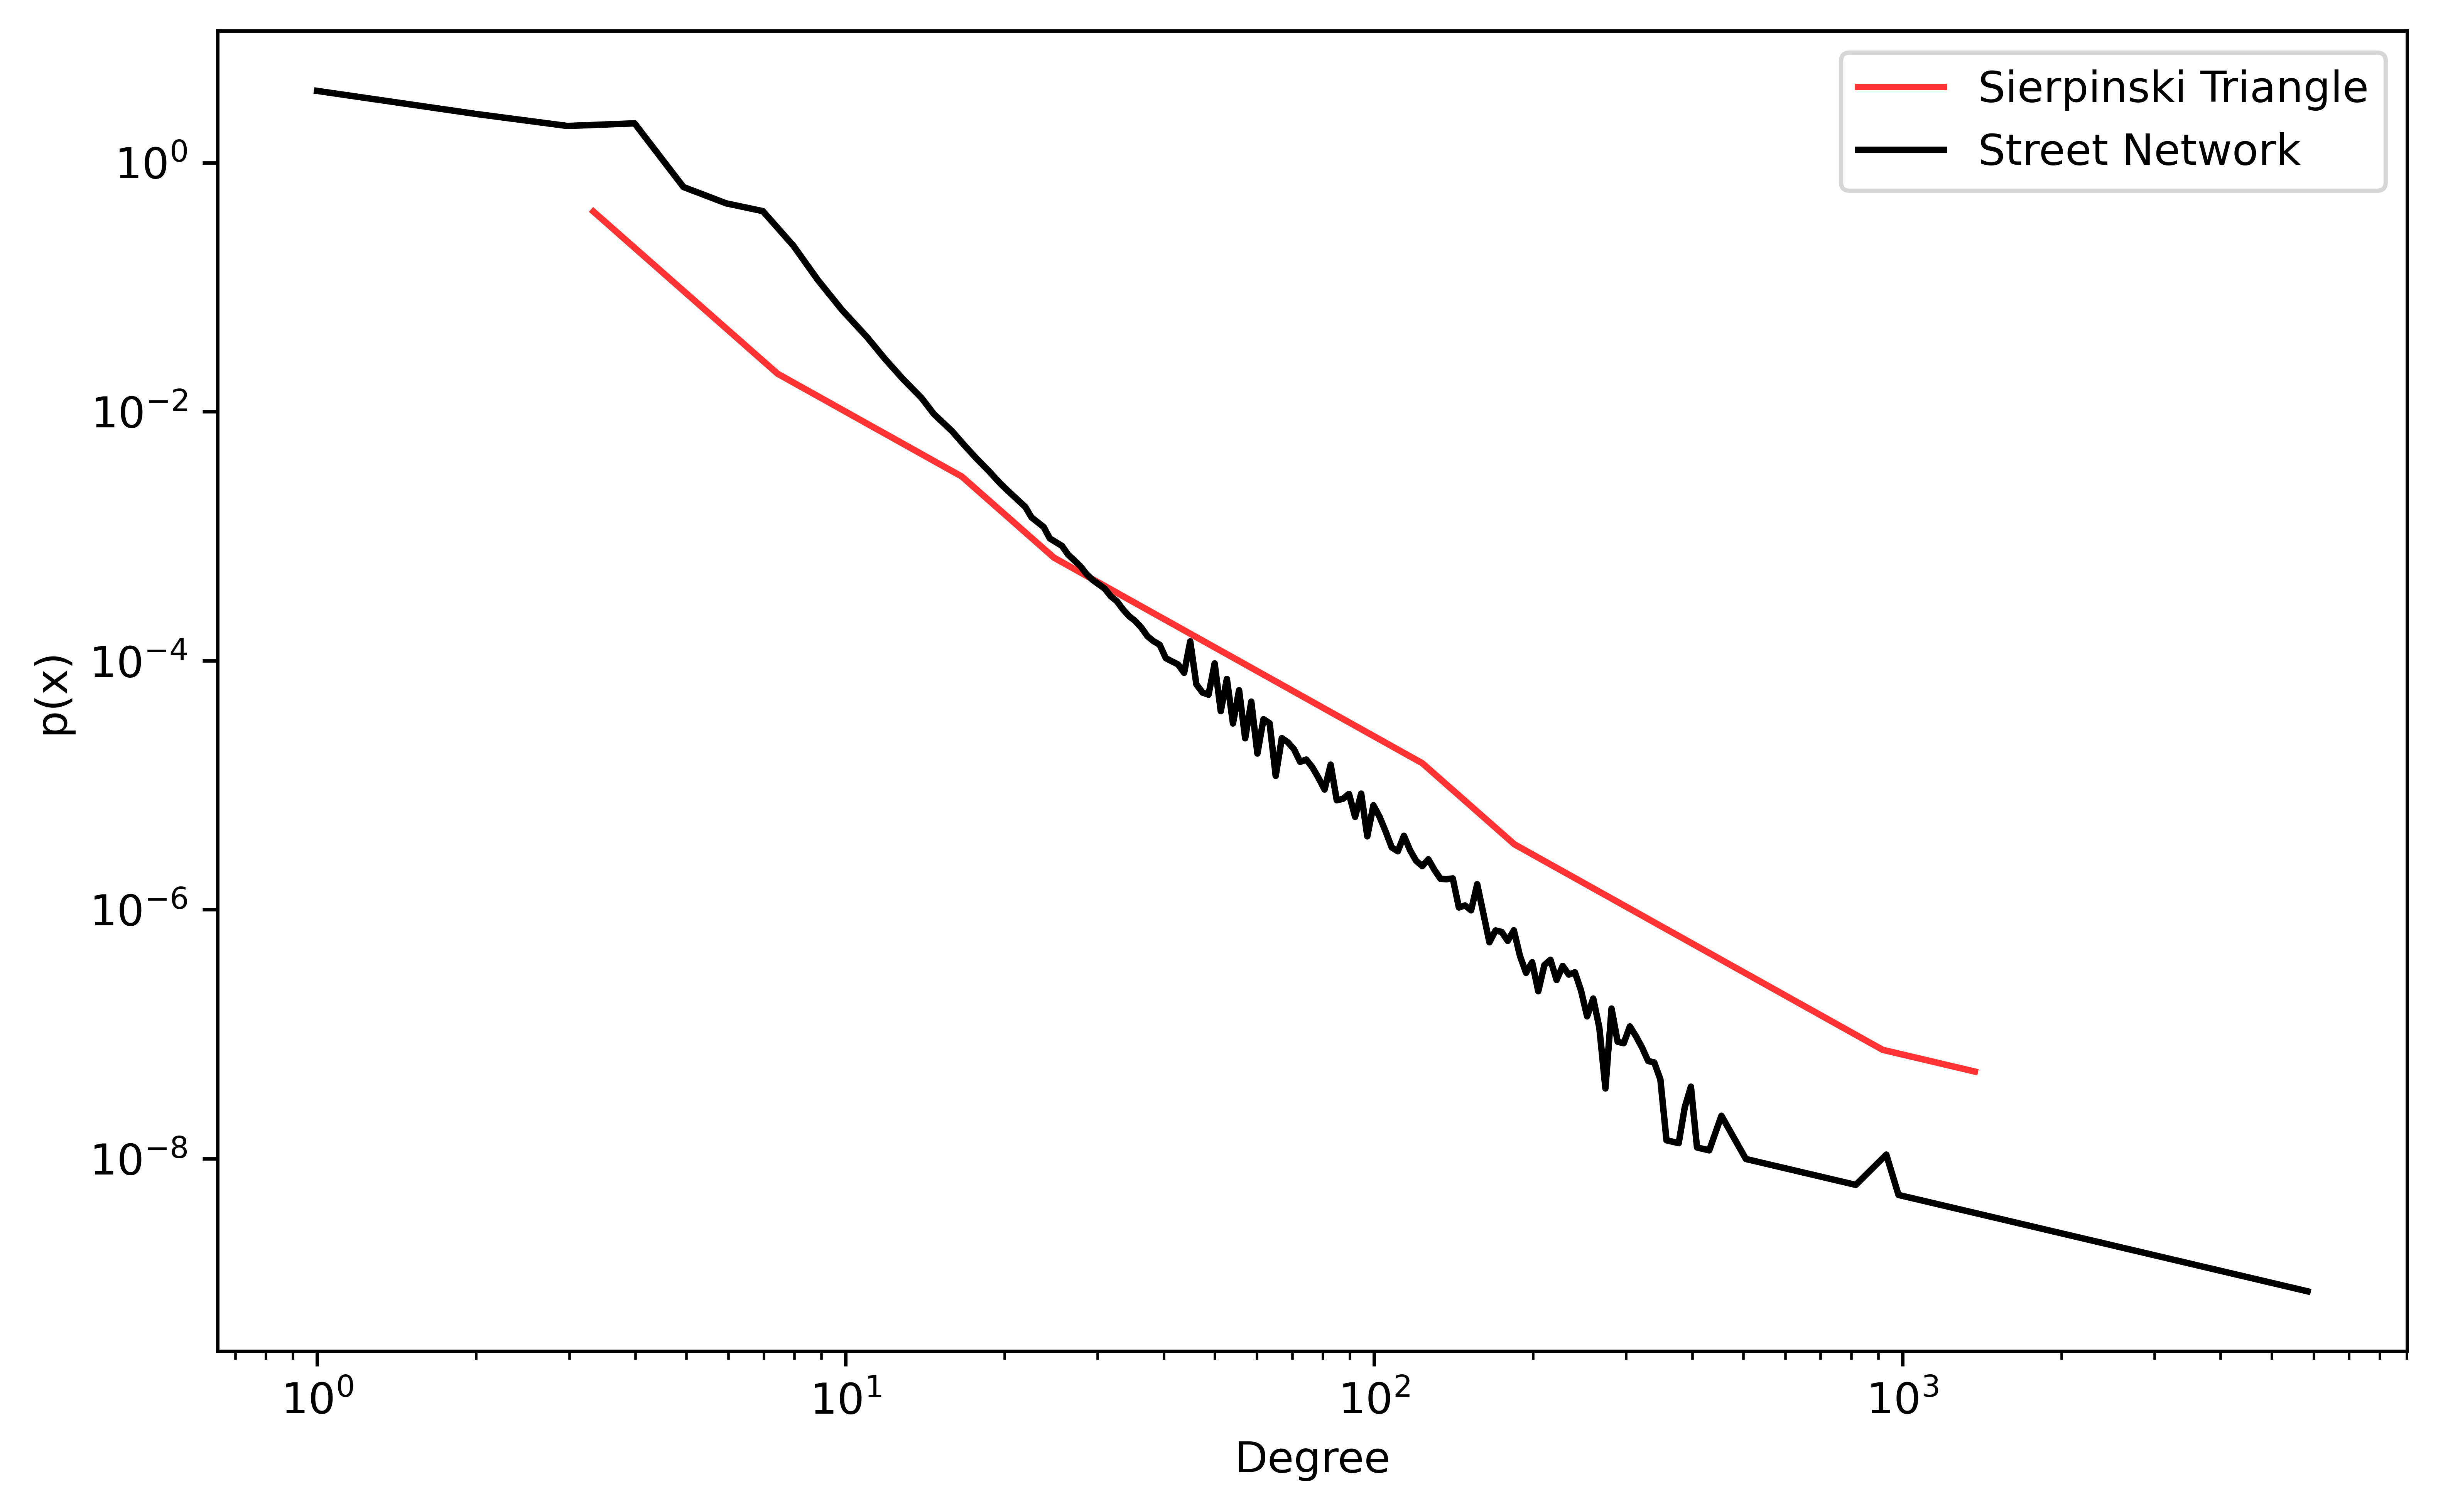
The degree distribution of the dual representation of the Sierpinski triangle can be compared to the street networks distribution.
 Figure 3: Degree Distribition
It can be seen that the two distributions both follows a power-law, highlighting the fractal nature of street networks.
The Sierpinski triangle is constructed from multiple equilateral triangles, which serve as the fundamental building blocks. These base triangles combine to form higher levels of hierarchy.
A similar analogy applies to street networks, where clusters of ‘15-minute cities’ combine to form larger urban areas, urban areas combine to create cities, cities combines to create regions, and so on.
As seen in figure 3 the two samples of degress do not follow the exact same distribition.
However there are many other geometrical fractals such as the Sierpiński carpet, Koch snowflake or even more complex fractals such as the mandlebrot set.
Is there a geometrical fractal that can explain the scale-free nature of street networks?
-
The Network Analysis of Urban Streets: A Dual Approach: Sergio Porta, Paolo Crucitti, Vito Latora ↩