Explaining Urban Walkability Through Network and Visual Features
Lasse P. S. H. / January 2024
Abstract
Understanding walking behavior in cities is critical to promoting physical activity and reducing reliance on fossil fuel-powered vehicles. Individuals’ experience of moving through the city is influenced by many factors, including the structure of the street network, the perception of safety, the accessibility of amenities, and the visual qualities of its built environment. Existing research has combined these elements into walkability indexes, which assess the pedestrian-friendliness of urban areas and are widely used in policy-making, academic research, and real estate. However, the factors explaining cities’ pedestrian-friendliness remain poorly understood. This, is partly due to the limitations of available data capturing walking patterns, with available walkability indexes mostly built on survey data subject to biases such as small sample size. In this project, I will address this gap in the field by developing a new model of walkability based on extensive smartphone data and a multimodal learning framework. First, I will utilize large-scale physical activity data collected through smartphones. These data enable us to study walkability at higher spatial resolution (street segments) compared to approaches based on survey data, as revealed by previous work based on small samples of individuals. Secondly, I will leverage the opportunities offered by data-driven approaches based on machine learning to develop a model that captures the complexity of walking behavior in cities. By employing a multimodal learning approach that combines street-view images, transportation and street network data, and other geographic information, this model aims to understand the complex interplay between urban environments and behavior across various cities.
Walkability Index
To measure the desirability of a street segment, we compare the number of trips passing through it against the number of trips along neighboring streets that have similar directions. The desirability score for a given segment \(i\) can be computed by the z-score, where a postive score indicate a desirable street and a negative a non-desirable street.
\[Z_i = {x_i - \mu_i \over \sigma_i}\]The Mean and standard deviation of trips along neighboring streets \(X_j\) weighted by the difference in angle between \(i\) and \(j\).
\[w_{ij} = 1 - \frac{|\theta_i - \theta_j|}{90^\circ}\] \[\mu_i = \frac{\sum_{j=1}^n w_{ij} x_j}{\sum_{j=1}^n w_{ij}}\] \[\sigma_i = \frac{\sqrt{\sum_{j=1}^n w_{ij} (x_j - \mu_i)^2}}{\sum_{j=1}^n w_{ij}}\]The following interactive map shows Copenhagen, where the red streets are deemed desirable and the blue streets are non-desirable. The full size can be found here.
Explaining Walkability
The individuals’ experience of moving through the city is a combination of many different factors and is a combination of both micro-level and macro-level features. In order to understand walking behavior of individuals it is important to consider both the network structure of the city and the enviormental features.
Network Features
To extract properties from the street network, we used a dual graph representation, where streets are represented as nodes and intersections as edges. Additionally, we applied street continuity, which ensures that streets remain continuous over multiple edges as long as the angle difference between them is below a fixed threshold. The following figure shows an example of the three stages, the street segments, the dual graph and the dual graph with directional continuity.
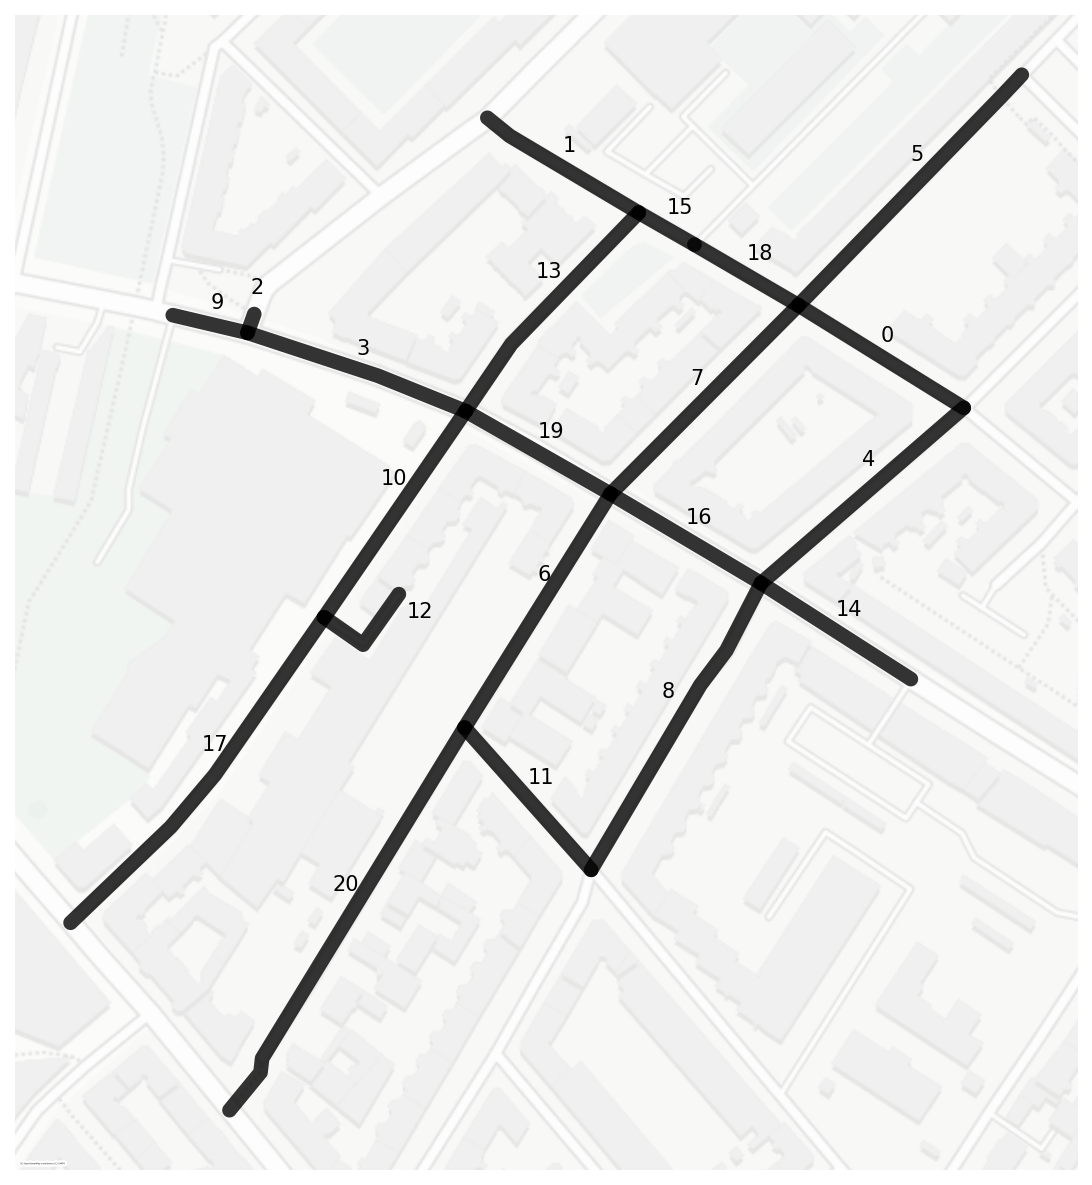

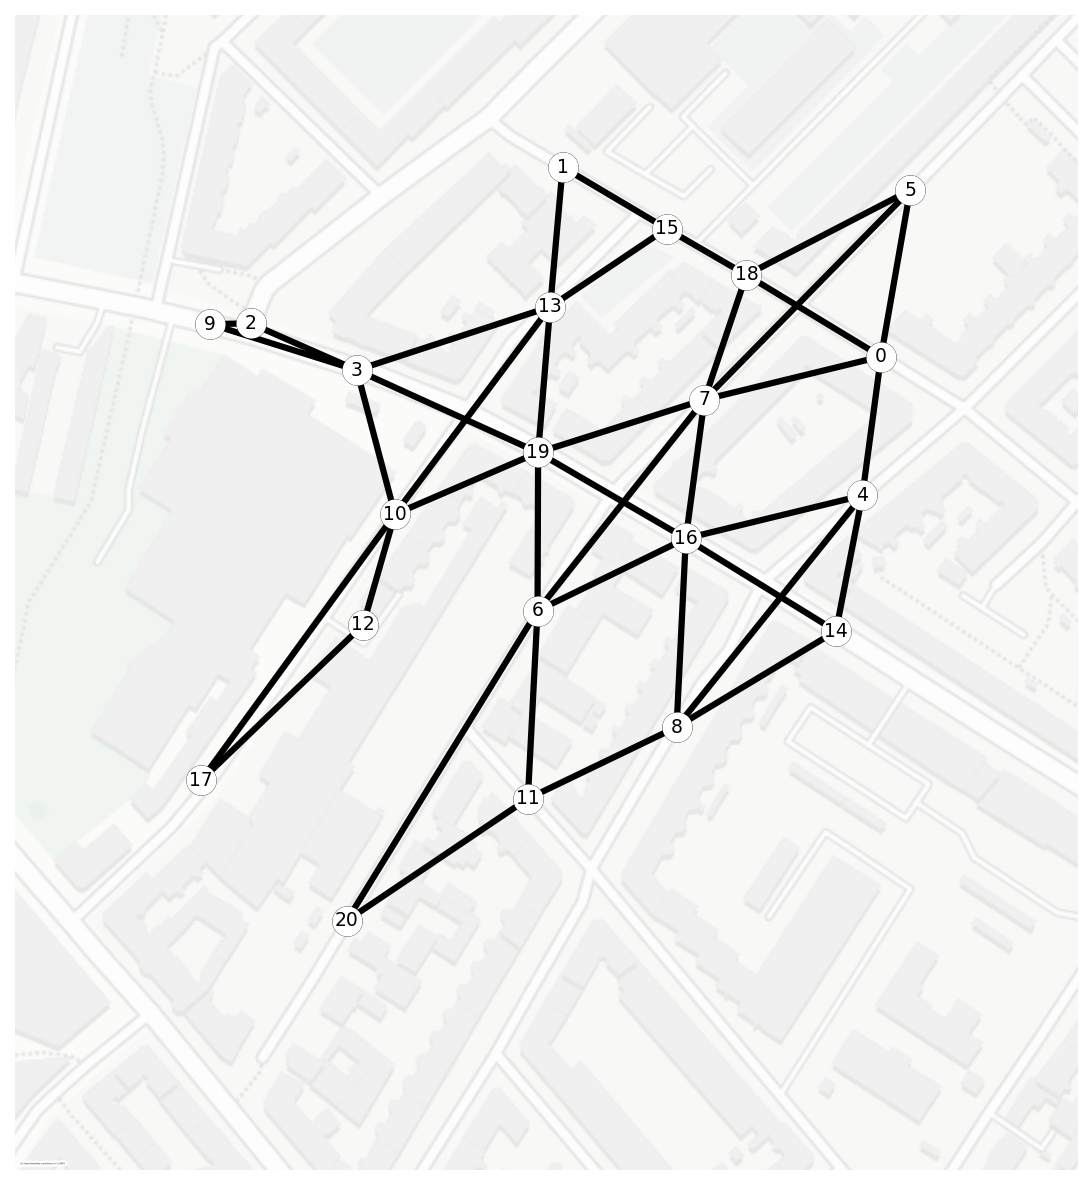
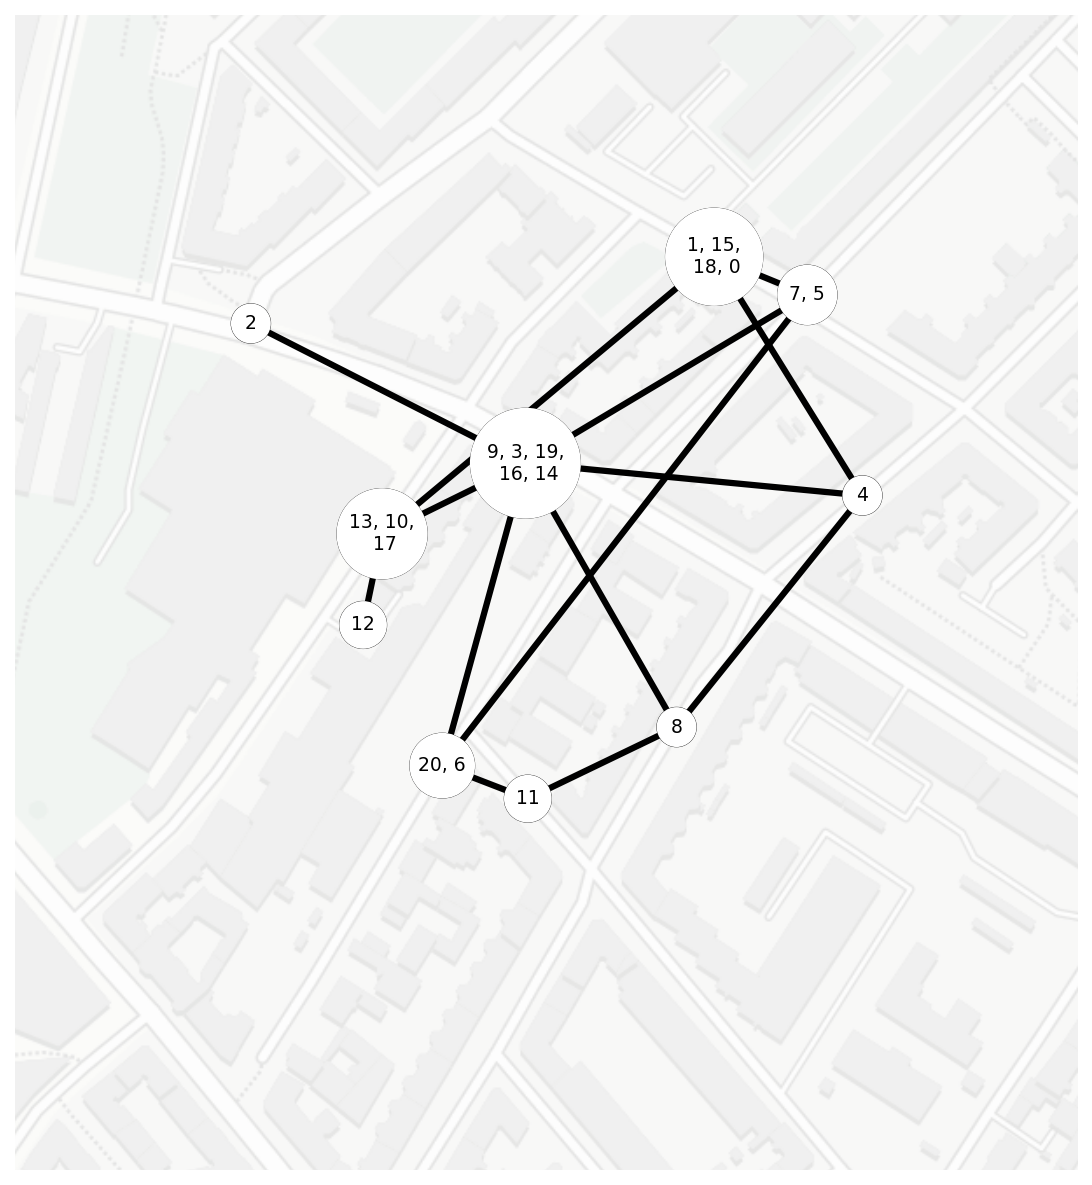
From the graph representation of the street network, we can extract valuable properties, such as the street hierarchy, represented by the degree of each node.
Visual Features
To capture the enviormental qualities we used the deep learning image model Segformer1 fine-tuned on the CityScapes dataset to compute a vector representation of each image that describes the environmental features from a given image \(I_i\). The Segformer model outputs the density of \(18\) different classes.
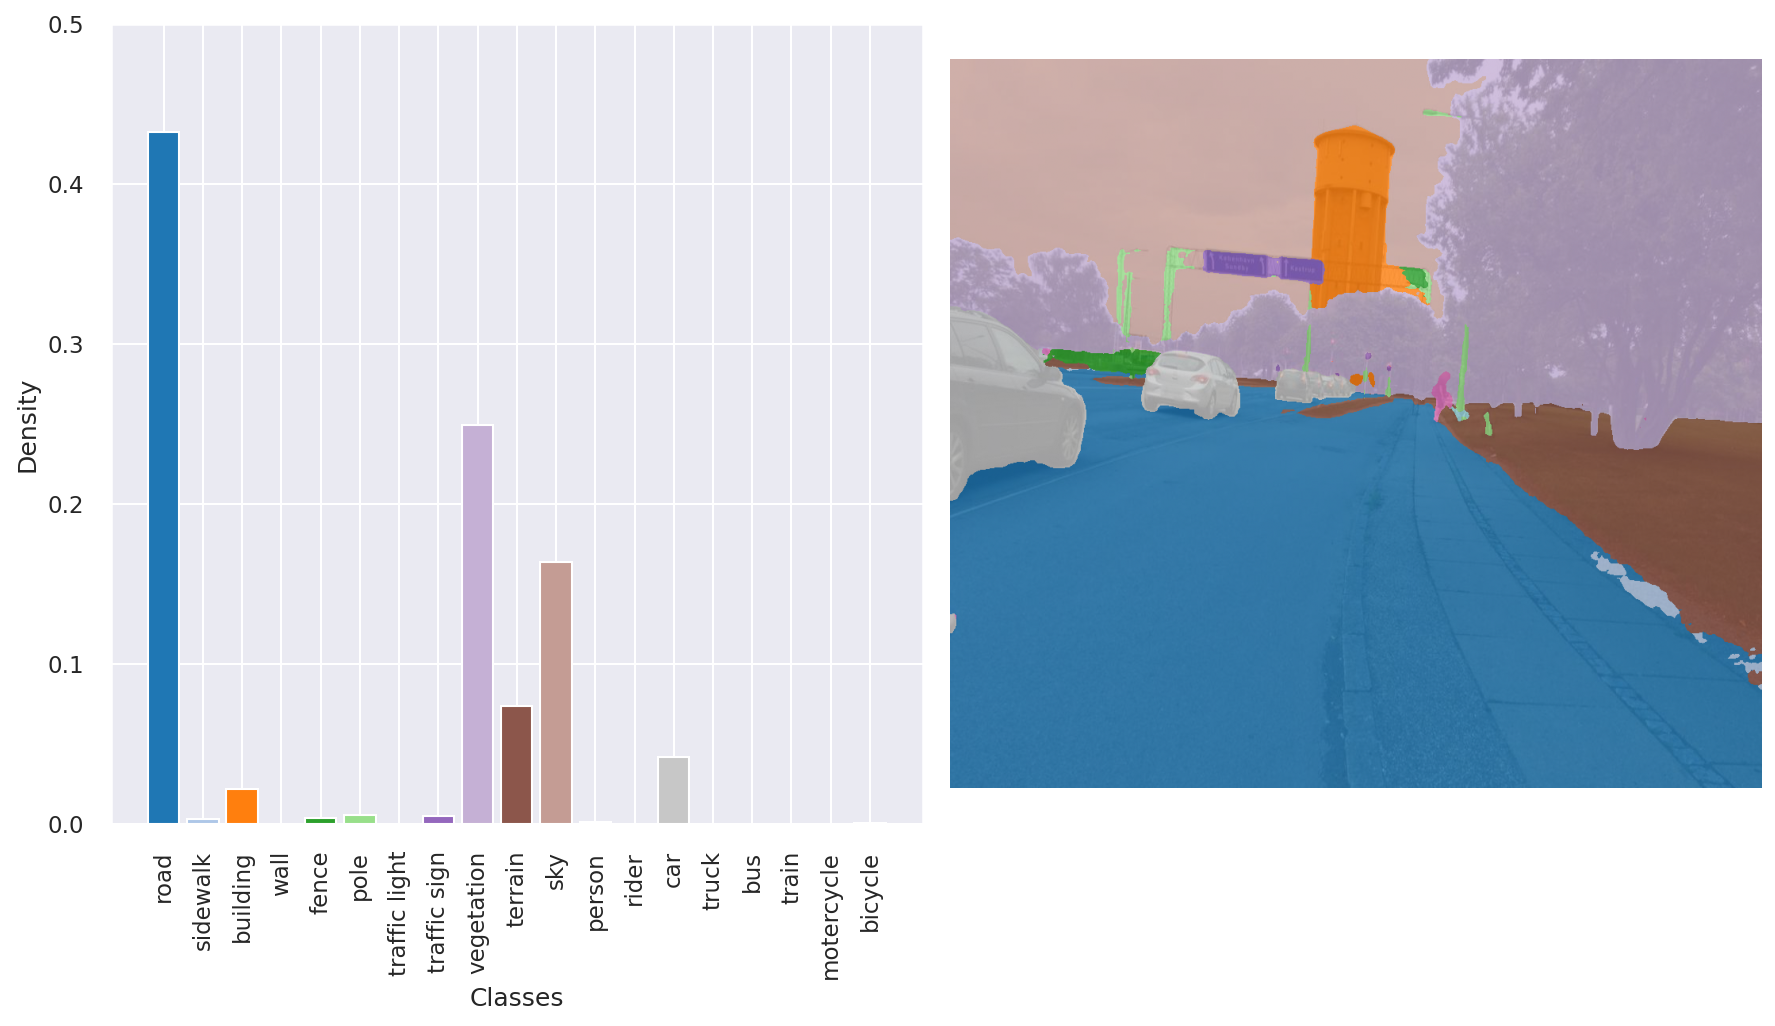
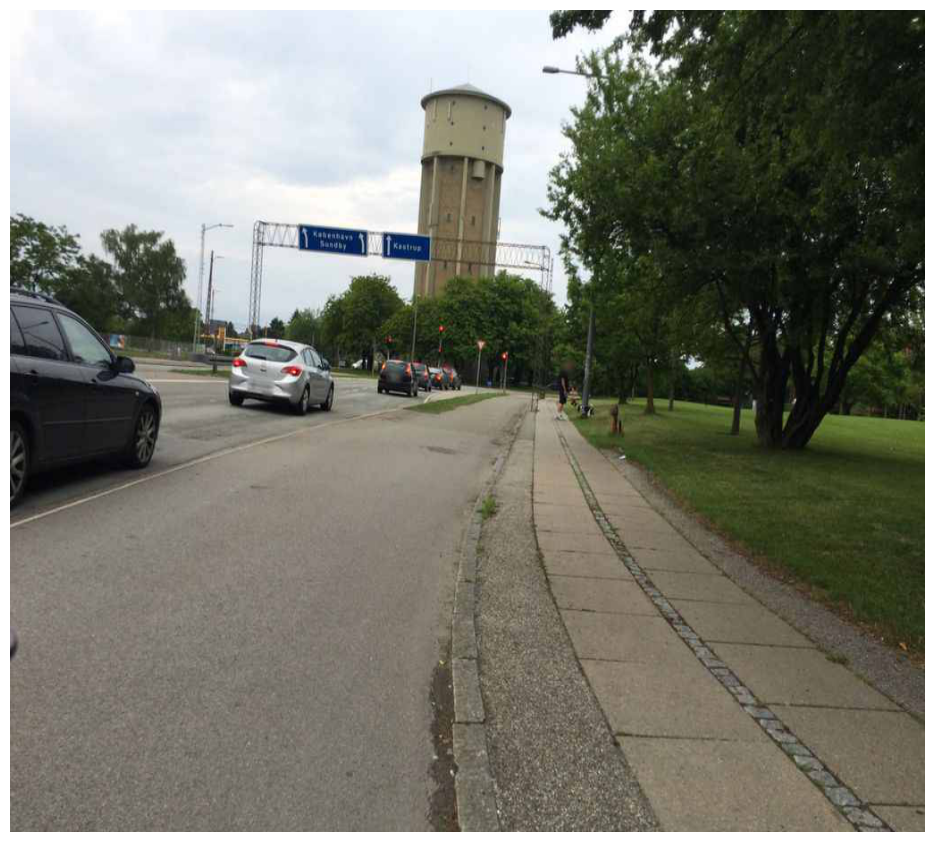
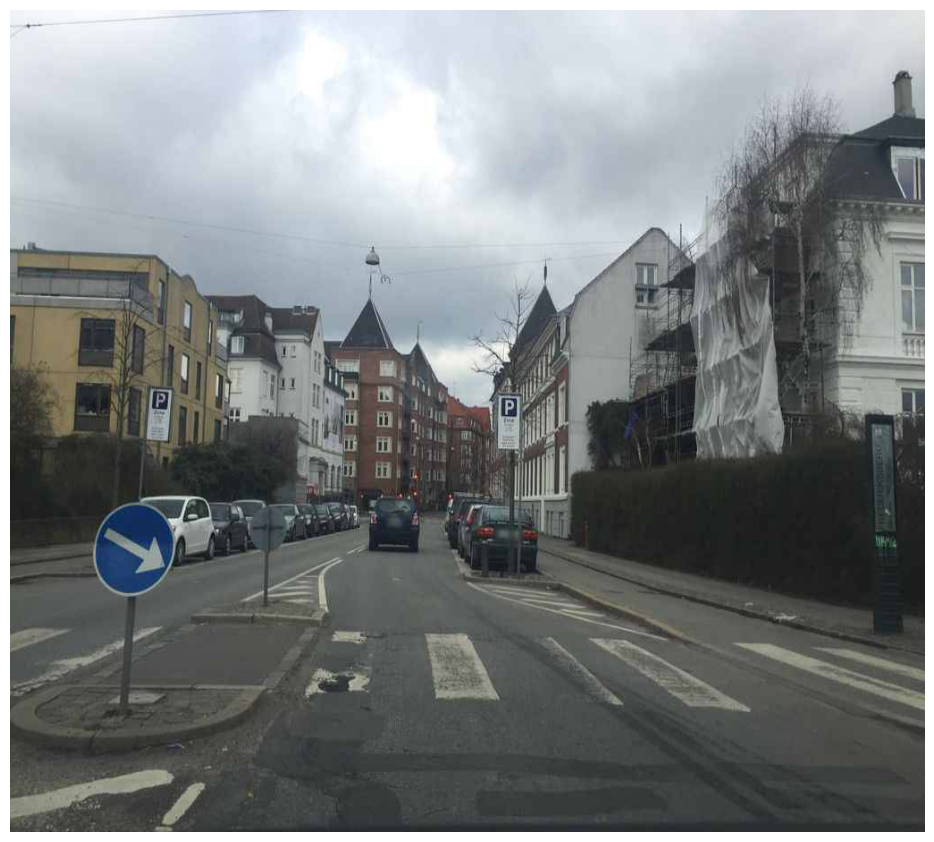
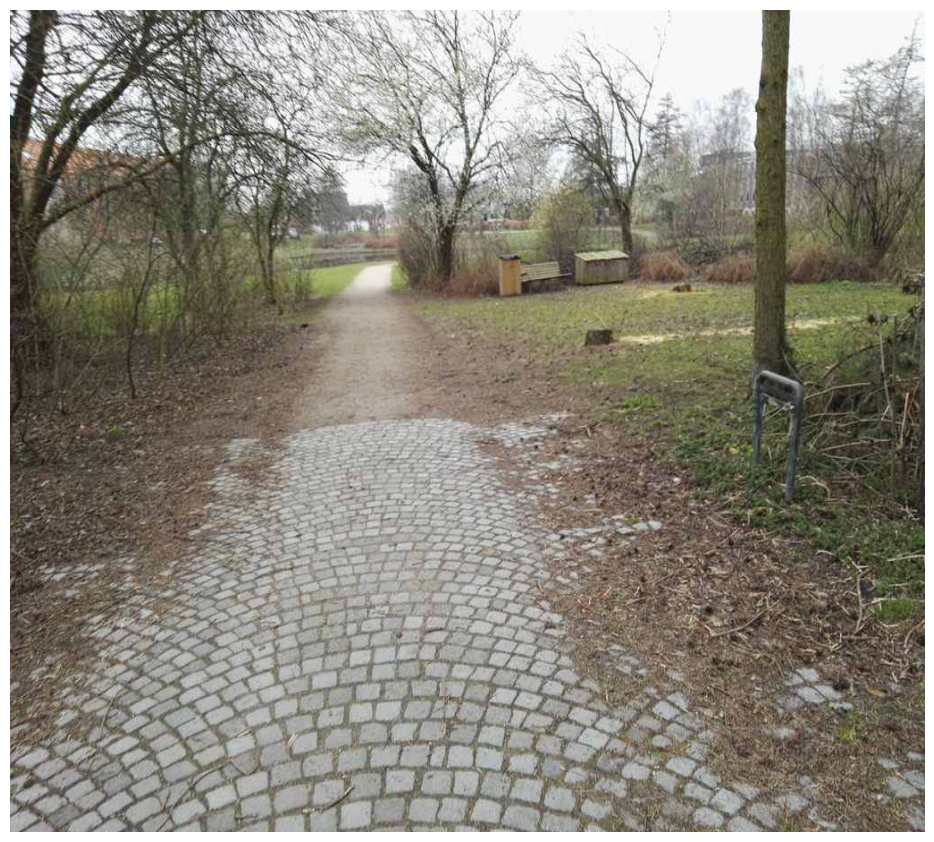
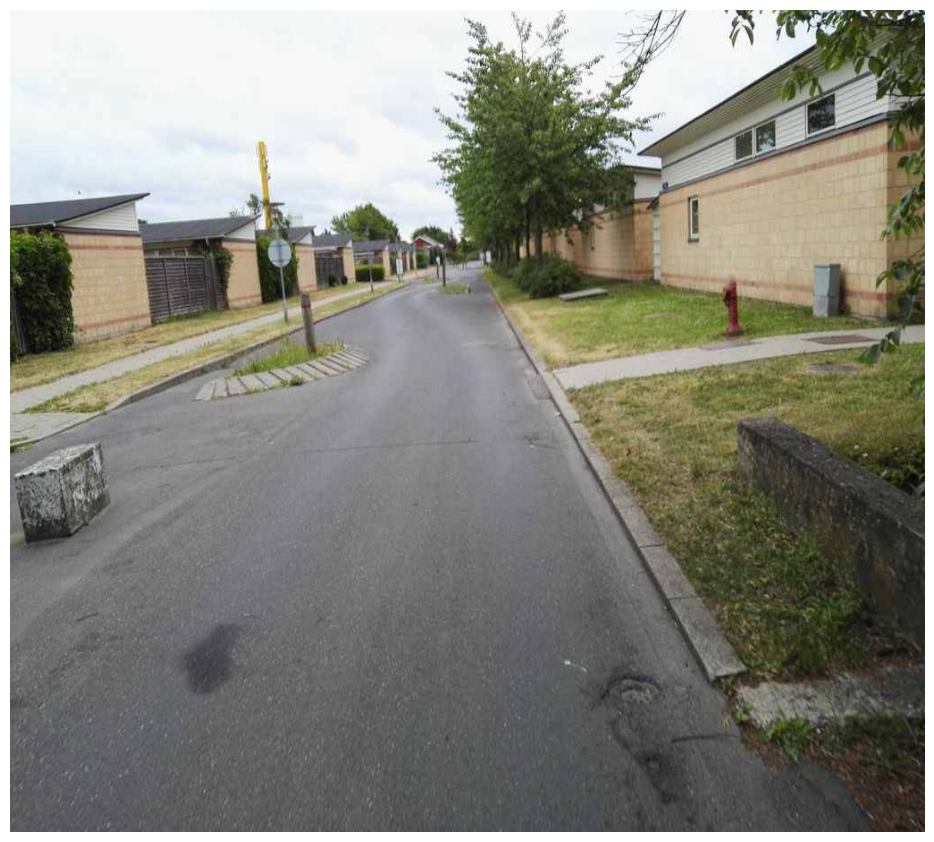
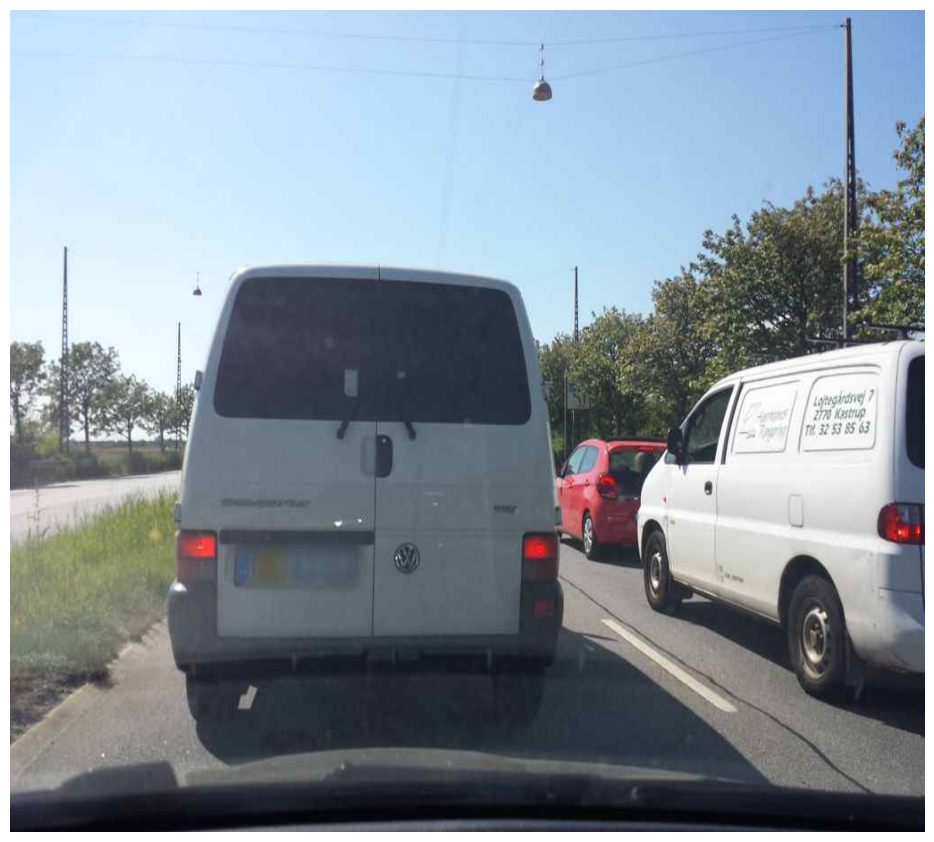
Each street segment contains multiple images. To get an average representation of the environmental features, an average across all vector representations from the Segformer model is computed from all the images related to the street segment:
Predicting Street desirability
To investigate the desirability of street segments, we trained a gradient-boosting classification tree (XGBoost) using tabular data from the image vector representation and features from the street network to understand the factors that capture street desirability. The model obtained a macro F1 score of \(0.79\) with a \(30 \%\) test size of \(26837\) and a \(70 \%\) training size of \(62617\). The following figure shows the confusion matrix of the classification model.

| Precision | Recall | F1-score | |
|---|---|---|---|
| Not Desirable | 0.7735 | 0.8283 | 0.8000 |
| Desirable | 0.8149 | 0.7572 | 0.7850 |
| accuracy | 0.7927 | ||
| macro avg | 0.7942 | 0.7927 | 0.7925 |
| weighted avg | 0.7942 | 0.7927 | 0.7925 |
Table: Performance metrics
The project was presented at NetSciX in 2024.
-
SegFormer: Simple and efficient design for semantic segmentation with transformers: Enze Xie , Wenhai Wang , Zhiding Yu , Anima Anandkumar, Jose M. Alvarez, Ping Luo ↩